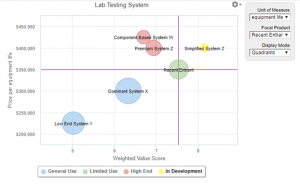
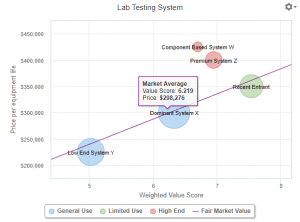
Value Maps provide a useful framework that helps visualize a  product’s positioning in the market. A Value Map is a two dimensional graph that displays product prices on the y-axis and shows product weighted value scores on the x-axis. The best Value Maps are customer-centric, basing value scores on customer benefits instead of product features or performance. Value Maps can be applied to help understand and monitor positioning, evaluate potential price changes and consider marketing and innovation strategy. By highlighting differentiation in what products deliver to customers, Value Maps are also a great starting point for quantified, dollarized or euro-ized value models and Value Propositions.
Limitations and Pitfalls. Maps are useful, but no map is perfect. Geographic maps are only as good as the knowledge and experience of those who create them and use them. Value Maps are similarly limited by the market knowledge and experience they capture, but they also have limitations as a framework for some situations and some applications. In this blog, we will ask five questions that point to the limitations and pitfalls of Value Maps, highlighting areas where they may require further work and where they may need to be supplemented with additional analysis.
1. How good are the benefit scores and weights? Analytical tools are only as good as the data they are fed. While the data do not need to be perfect for an analysis to be useful, Value Maps are especially prone to the risk of low quality data. Within a Value Map, data quality risk is greatest for the aggregate value scores shown on the x-axis. Compared to many other strategic analyses, Value Maps are relatively easy to construct. Three or four people on our own team can sit in a room for an hour and get to a Value Map. A strong personality on the team, potentially with limited or biased customer experience, can list competitors, look up their prices and have enough perspective on product differentiation that they enumerate benefits, weight them and score competitors on the benefits, leading the rest of the team to a fast result. In the absence of critical thinking or discussion, a Value Map quickly materializes with potentially dubious implications.
The benefit of deriving an internal Value Map together comes precisely from team discussion of the benefits, weightings and scorings. The in-house disagreements that arise should generate more questions and actions for follow-up than they provide immediate answers. The act of creating an internal Value Map is usually most valuable because it identifies what we don’t know about our own competitive landscape. Value Maps should be hypothesis-generating. Internally generated Value Maps should require follow-up and refinement to build better-informed team consensus.
Additional confusion arises if we lose perspective on whose Value Map we are looking at. Just because our own objective investigations highlight that certain points of differentiation are both substantial and important, does not mean that customers will share those perceptions. Clarity regarding whose Value Map we are considering is crucial. Commercial teams should take the opportunity to interview customers or conduct market research to understand the differences between our own best assessment of objective reality and customer perceptions in the marketplace.
2. What do Value Maps tell us about customer willingness to pay?  Value Maps are a great framework to organize thoughts regarding features or benefits that are multidimensional. The more that we trust the weights that we (or our customers) apply to these features and/or benefits, the more tempting it is to view the aggregate value score as a single yardstick that can be directly compared to price. This can lead to overconfidence in using a Fair Market Value line to assess customer willingness to pay.
Even if we believe that survey data (as opposed to actual purchases) reveal the choices that customers will make in the market, good statisticians know that better methods to measure customers’ willingness to pay for certain features or benefits are available. Presenting customers with choices between bundles of features (or benefits) at specific prices is the foundation for good conjoint analysis. Conjoint studies, when well-designed, are widely accepted as a more rigorous way to understand the value of specific features (or benefits) to customers.
Although Value Maps are useful in generating hypotheses about customer perceptions, there may be better ways to test those hypotheses.
3. What do Value Maps tell us about setting prices? Good Value Maps ask important questions about what customers value. The benefits that customers value relate to our ability to charge and defend a premium price. For the mathematically inclined, there is something soothing about looking at value and price through the two dimensional lens of proportionality. Value Maps invite users to apply Fair Market Value lines, based on ratios between value and price. For B2C products, this can be a good way to get an initial assessment of where we can price.
For B2B products, where customers often do the math, there is a fundamental difference between looking at the ratio of a value score to price versus performing an analysis of economic value using Economic Value Estimation® or other approaches to measuring economic value. As Tom Nagle and Gerald Smith have highlighted[1], objective customer value, well-estimated, can be directly compared to price where a difference calculation provides a better way to assess customer decision-making than a ratio. The result, they argue, is that Value Maps undervalue differentiation systematically. The resulting is that prices based on Value Maps tend to be set at levels that fail to realize fully the customer value created.
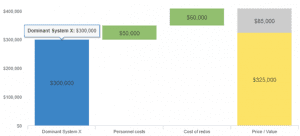
 This discrepancy is illustrated in a Value Map from the lab systems Case Study in our previous blog. Based on a Fair Market Value line through the market average at current prices, Recent Entrant looks like it is priced within $10,000 of the Fair Market Value line. Yet an EVE value model based only on the most obvious tangible value drivers for Recent Entrant versus its next best alternative, Dominant System X, shows that the customer achieves significant value ($85,000) net of price. This suggests that a price based on the Value Map will leave substantial value on the table for the customer. That may be the outcome we want if our aim is to penetrate the market, but it suggests that the Fair Market Value line may be far from a “neutral” pricing strategy.
Despite the additional insights from economic value modeling, quantifying customer value takes extra work. For less important B2B products, where the impact of extra work may be limited, a Value Map frequently provides a reasonable approach to pricing. For strategically important products, the extra work of economic value modeling is usually worth it.
4. Can we use Value Maps to communicate our value to customers? A related shortcoming of Value Maps for B2B products is that they are not effective communication tools. When buyers do the math, they add and subtract real economic impacts on their business and compare those dollarized benefits to price as they consider ROI and net value. B2B buyers usually have internal decision criteria that are aligned with estimating economic value. Buyers don’t usually set up a scoring framework, determining weights and value scores and looking at ratios. They create an internal business case to buy based on dollarized costs and benefits. Even if buyers did use Value Maps for an internal evaluation of alternatives, they would be unlikely to engage with sales teams presenting a dueling version of their own Value Map.
Value Propositions that incorporate math based on economic value modeling are the only choice our sales team has if they want to engage buyers in rational conversations about why they should buy our solution. Value Propositions that go beyond features to qualitative, quantitative and financial value speak ![]() directly to buyers’ internal decision criteria. Strong Value Propositions start as a Flexible Case Study early in the sales cycle, are tailored, as buying teams evaluate alternatives, into a Value Analysis specific to the buyer, and ultimately become a specific Business Case to Buy shared with a buying sponsor as a deal moves through internal approvals, negotiation and finalization.
directly to buyers’ internal decision criteria. Strong Value Propositions start as a Flexible Case Study early in the sales cycle, are tailored, as buying teams evaluate alternatives, into a Value Analysis specific to the buyer, and ultimately become a specific Business Case to Buy shared with a buying sponsor as a deal moves through internal approvals, negotiation and finalization.
That said, Value Maps are a great first step towards a strong Value Proposition. They jump start good value modeling and provide perspectives on differentiation versus the various competitors that commercial teams usually face in the marketplace. But the role of Value Maps is limited. While they inform good Value Propositions, they are not useful sales tools.
5. Do Value Maps help identify opportunities for disruptive change in markets? In a recent Richard Rumelt interview in the Harvard Business Review, he recounts a 1998 conversation that he had with Steve Jobs about strategy. After highlighting several important, complex, competitive challenges for Apple, Rumelt asked Jobs about his longer-term strategy. Jobs’ answer was simple: “I am going to wait for the next big thing.”
It is unlikely that Steve Jobs chose major strategic initiatives at Apple using Value Maps. Disruptive change in a market may relate to current products, their features and their benefits, but usually disruption results from identifying new possibilities that result in benefits that may not be available with today’s products or may not be recognized as valuable by today’s customers. A Value Map based on today’s snap shot of any given market is unlikely to identify disruption opportunities based on customer interviews. An internal Value Mapping discussion will only help to identify opportunities to disrupt a market if we have a genuine disrupter participating on our team. Even then the disruption opportunity is more likely to arise from the discussion than from a team-consensus or customer-interview-based Value Map of the current market.
The Role of Value Maps. Implementing a product management discipline requiring Value Maps supplements a technology/product focused strategy with a stronger customer focus. Value Maps help to drive better customer understanding in product strategy and can be applied in many useful ways, including understanding and monitoring product positioning, thinking about pricing moves by competitors and identifying marketing and innovation opportunities. Value Maps are a good start in making product strategy more customer-centric, but Value Maps have limitations and should be augmented and improved with deeper analyses and customer understanding for strategically important B2B products.
[1]Thomas T. Nagle and Gerald E. Smith, “A question of value, Customer value mapping versus economic value modeling,” Andreas Hinterhuber and Todd C. Snelgrove eds., Value First Then Price, Quantifying Value in Business-to-Business Markets from the Perspective of Both Buyers and Sellers, Routledge, 2017.

