The second in a series of articles with practical advice for quantifying customer value.
In part one we covered how to quantify the value of reduced downtime. For this installment we tackle another favorite source of intangible value: brand reputation.
It’s amusing whenever you see a product manager slap a buck or two of unexplained “brand value” on top of their offer’s value stack. Especially after they’ve gone into painstaking detail to quantify just a few cents of tangible operating cost savings. Believe me, if I’ve seen this once I’ve seen it at least a dozen times. Product managers do this in order to help their projects pass an important gate review. They don’t make the effort to understand what their brand value is worth, somehow expecting it will be self-evident to customers as well as their sales team.
Don’t Measure a B2B Brand like a B2C Brand
Here I think our consumer products colleagues have it easier than we in the B2B space. They have better tools and data at their disposal for measuring brand power and how that translates into market share, consumer willingness to pay, and  profitability. Also, they have the advantage of relatively fast buying cycles. In their world, competitive battles are fought daily on the shelves of retailers and shopping websites. It’s a tough business, but any competent consumer product manager knows where their brand stands in the minds of their customers (versus their rivals) and whether the trend is rising or falling.
Not so much on the B2B side. It’s a daunting feat to estimate how much influence a corporate global logo has on a specific B2B customer’s willingness to pay for a particular component or solution. Can we really measure the brand value of pumps, adhesives, coatings, additives, etc. with the same degree of rigor as a leading shampoo brand?
We try. Usually B2B product managers will resort to Value Maps for this purpose. Value maps are a popular tool because they can be easy to whip up and simple to interpret. They are also very prone to misuse and practically worthless for the task of quantifying brand value. For further reading on the pitfalls of Value Maps for quantifying value, see: Confessions of a Spreadsheet-Aholic: Using Value Maps in B2B Product Positioning.
So from my perspective, Value Maps are a dead end. What can you do?
How to Determine the True Value of a B2B Brand
Begin by investigating what your brand really means to your B2B customers. You will likely discover that it’s not as lofty as your corporate brand messaging; for example, your company’s commitment to “making planet earth a better place for all.” Although customers don’t object to that higher purpose and find it commendable, chances are that it’s not the primary impression they think of at the time of purchase.
There’s this folklore in pricing circles about a consultant who determined that the true source of a superior brand reputation was really in the packaging of the material. That’s it! Customers paid more because the packaging made it easier to store and move around their facilities. Just think about the negatives consequences of a decision to redesign the packaging in order to save costs (or the planet). Talk about a bad case of “thinking outside of the box”!
Regardless of whether that tale is true, it does highlight key differences between B2B and B2C branding. First, B2B brand image is created more by direct user experience as opposed to advertising, so individual touch-points are critical. Second, there are usually multiple and different impressions depending on the type of user (or stakeholder). So B2B branding is more straight-forward and multi-dimensional than B2C. Corporate buyers are not big into image or slogans. Perhaps the closest thing in B2B to the iconic “Just do it!” is the old saying “Nobody ever got fired for buying IBM.” – and that never even was an official slogan!
Example of how to measure a B2B brand
 One B2B brand story from my own first-hand experience was a chemical company who commanded higher pricing for their so-called commodity materials sold to oil and gas
industry customers. It didn’t take long to reveal that the company’s favorable brand was strongly associated with excellent technical support. Their customers could call upon a knowledgeable technical engineer whenever a critical question arose about using their materials in their refinery process. Contrast that to the low-cost/no frills competitor that had nobody to call. I don’t recall the specifics, but let’s say that Company X charged a 25% premium per pound for that material. Is 25% the true value of its brand?
Not exactly. It’s more accurate to say that the 25% premium is how much brand value Company X captured in its price. The real value of the brand might be significantly higher – meaning that Company X could be leaving money on the table.
There are multiple ways to quantify the value to customer of this technical support. All it takes is to think through what additional costs the oil and gas customer would incur if they chose the cheaper, no-alternative. Here are three approaches:
- Cost of having an in-house tech support resource. The customer would need to dedicate one or more engineers with the right material expertise to be on call whenever a question would occur. To estimate the cost, you would need:
- The fully-loaded salary of that person(s) per year. Multiplied by:
- The percentage of time that resource is dedicated to answering questions. Plus, the:
- On-going costs of training, certification, etc. to maintain the resource’s expertise, and perhaps:
- The upfront cost of recruiting and hiring the resource
- Cost of hiring external consulting support. Alternatively, the customer can outsource their tech support to a third-party consultant on an as-needed basis. To estimate the cost, you would need:
- The hourly rate of the service. Multiplied by:
- The number of hours per year spent answering questions. Or,
- The annual cost of a fixed-cost contract. This might also include:
- The cost of any delays (downtime) in a finding a resource.
- Cost of taking a risk. Another option is to make-do without the benefit of any expertise. This may be tempting for a cost-conscious operator. It’s obviously a risky approach – even if the chances of a bad thing happening are very low, they still can be very costly on an expected-value basis. To estimate this cost, you need:
- Identification of potential adverse events (and percent likelihoods). This can be range of incidents ranging from the minor (higher defect rate) to catastrophic (employee death/injury). Multiplied by:
- The cost of each event which can include: rework costs, lost revenue, damages, government sanctions, lawsuits, etc. This may also include:
- Cost of higher insurance premiums
Consider Brand as part of your Augmented Product
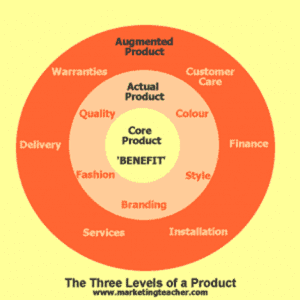
This story about technical service is but one dimension of an augmented product. First described by Philip Kotler in the 1960’s, this is a fundamental concept appears in just about every marketing course. A simple, practical version of this concept is shown below (from marketingteacher.com).

Value drivers can be created for any of the items at the Augmented Product layer provided they are: 1) unique to your product and 2) provide value to the customer. If not, then they cannot be considered a source of differential value or a contributor to your brand’s value.
Consider Brand as Multiple Stakeholder Touches
Again, the role of stakeholders is an important difference in B2B branding. B2B products tend to cut across multiple functional silos, with each function having its own distinct impression. Therefore, the reputation of a brand can vary depending on who you are talking to. However, we can safely assume that Procurement folks will tend to show no favor toward your particular brand. For them, we can assume brand value equals exactly $0.
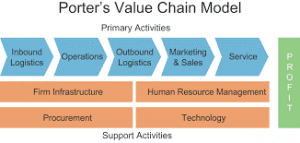
So you need to look elsewhere. One useful tool that I like to use for finding stakeholders is Michael Porter’s value chain model. From his classic book Competitive Advantage, it maps the key functional areas of any business.

Source: Strategic Management Insight
In my experience working with product teams, I’d say +80% of value drivers fall into the “Operations” bucket. This is where most tangible value drivers live, for example, “less material used,” “less labor required,” “less energy use,” and so on. But as our packaging and technical services examples have shown, it is definitely worth the effort to look beyond the obvious, familiar areas. Think of Porter’s Value Chain Model as a map that points out new, uncharted territories and potentially fruitful areas to explore.
Brainstorm how your customer experiences your product within each of these boxes, For instance:
- Inbound Logistics: Do you provide faster, more reliable, more convenient, just-in-time delivery?
- Outbound Logistics: How do you improve your customer’s distribution and/or delivery channels?
- Marketing & Sales: Do you help your customer communicate and sell to their customers? Do you improve customer loyalty or increase lifetime value of customer?
- Service: Do you provide after-market support? Do you reduce their downstream costs, e.g., returns, customer service calls, etc.?
- Firm Infrastructure: Do you reduce your customer’s capital expenditures, particularly in property, plant and equipment?
- Procurement: Does your solution simplify the ordering and bill process? Does your “full-service” offer eliminate the need for other vendors? Do you provide easier payment terms?
- Human Resources: Do you provide employee training? Do you improve the health, safety and/or well-being of employee?
- Technology: Do you help improve your customer’s technology investment? Do you provide unique market intelligence data?
In conclusion, the value of a brand can mean many different things for B2B customers. Hopefully this article has given you some ideas of how to quantify this intangible advantage and turn it into a practical point of differentiator that you can effectively communicate to your customers.

