In this period of rising prices and increased competition, B2B organizations must be able to demonstrate the differentiated value of their offerings more than ever. But how effectively are these companies integrating value-based best-practices within their commercial processes?
This fall, LeveragePoint conducted its first-ever State of Value Management Survey. The goal was simple – to obtain a snapshot of the ways customer value is currently being utilized by B2B organizations to make smarter decisions, boost commercial outcomes, and grow profitability. By surveying our extended audience, we hoped to capture ways that value is deployed across the following two dimensions:
- Value Strategies: B2B pricing, go-to-market, product management, and marketing processes and decision-making.
- Value Selling: B2B marketing, pre-sales, sales, and post sale execution.
Some of the key trends we observed are:
- B2B professionals are confident in their Value Management execution. Our survey respondents were generally confident in the execution of their value management initiatives relative to their peers.
- Senior management is more confident in their value initiatives than frontline managers and contributors. One thread that emerged across the results is executive leadership being more confident in their organizations value execution than the managers and contributors reporting to them.
- Value management adoption varies across different industries. There was a noticeable difference in the utilization of customer value in the pricing, NPD, and product management processes across verticals, with some industries (such as healthcare and chemicals) more mature than others (such as logistics).
- Perceptions of sales’ value content utilization varies by job level & role. Perceptions on the successful deployment of value content, both in sales enablement and training, varies based on both job function and hierarchy. Overall, product, pricing, and value management professionals were less confident than other functions, such as marketing.
- Value is underutilized at certain points in the sales process. Our respondents indicated that value was frequently used to engage decisionmakers, but less likely to be utilized in early-stage call prep and in late-stage negotiations. We also found that companies are not using value often enough to unearth opportunities in existing accounts.
Over the coming weeks, we will be sharing more updates that explore these findings in further detail. But first, let’s take a brief look at the audience of our survey.
Survey Demographics
Overall, there were 357 respondents (95% Confidence +/-5% MoE) over the 5 weeks the survey was open, from mid-September through mid-October. We used a number of channels to promote the survey to our audience, including email (both direct and in our newsletter), social media, targeted 1×1 outreach, one in-person event, and our website. One important note is that the makeup of our audience is primarily B2B organizations, many of which have a strong focus on value. Thus, the findings of this survey reflect the sentiments of what we consider to be the core B2B value community.
Before delving into the core questionnaire, we asked respondents to share a few demographic data-points. When breaking down the findings, we discovered that drilling down the sentiment responses across demographics yielded some of the most interesting findings.
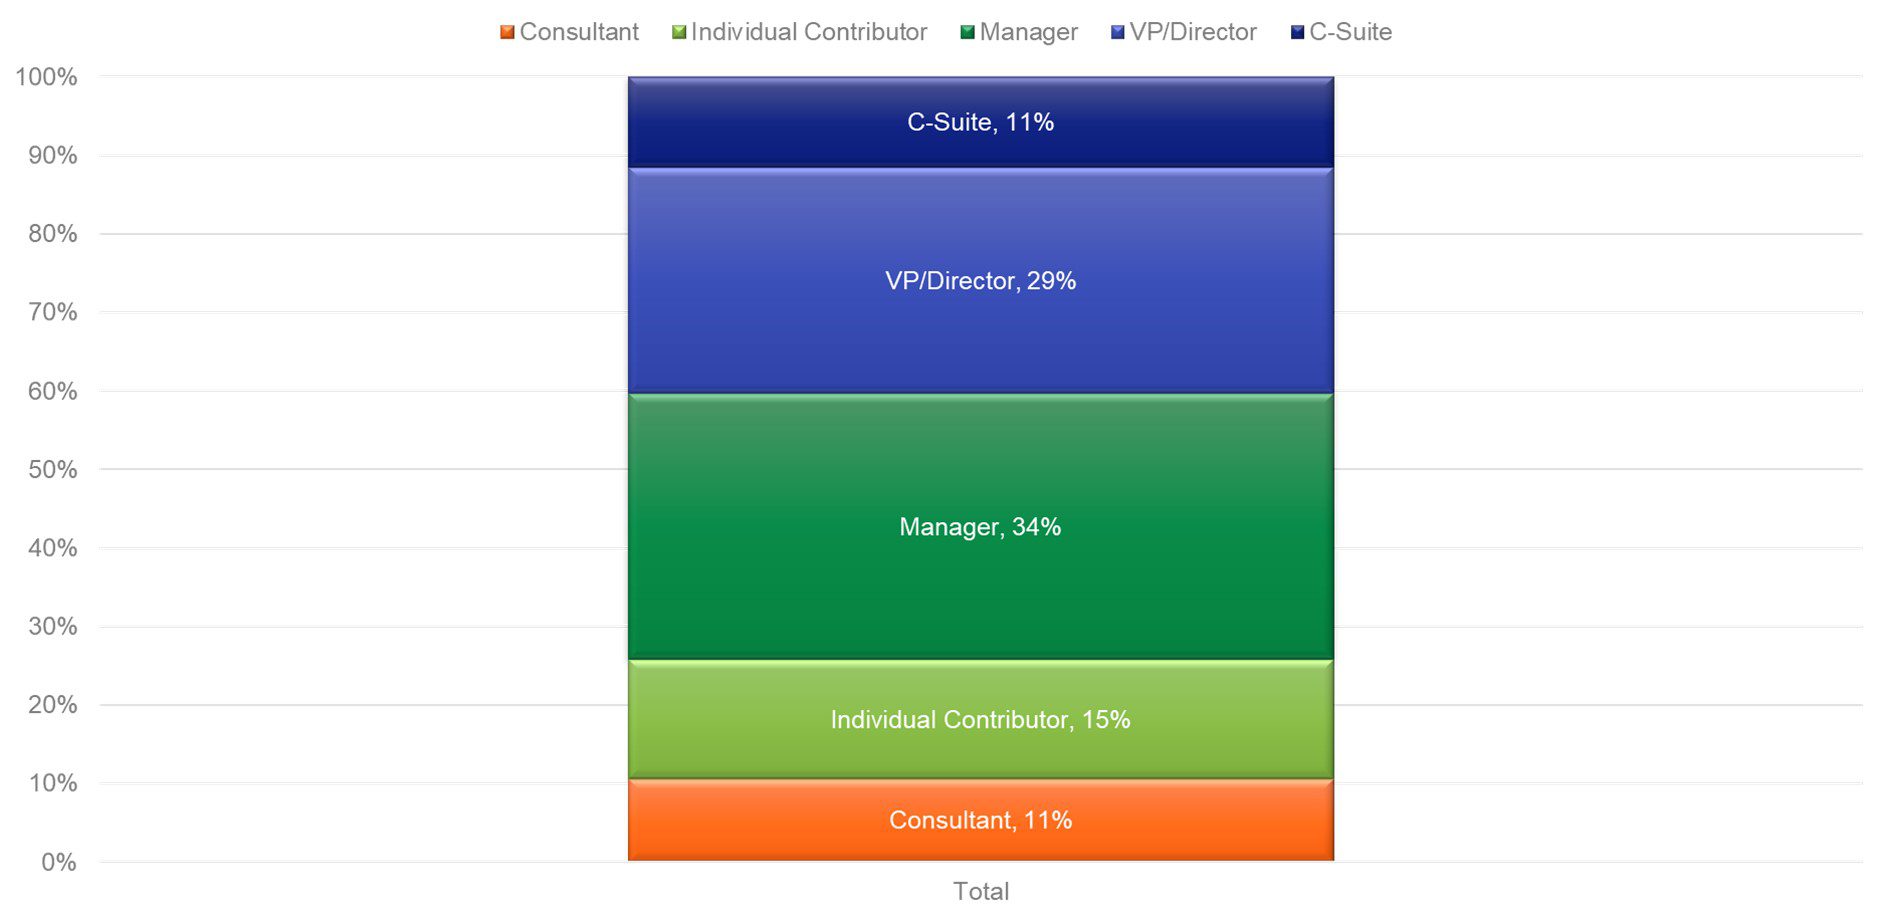
- Job Function: We were pleased to see a good mix of senior management – 40% (50% if you count consultants in that bucket), and 50% mid-management and contributors. Close to two-thirds of respondents were either VPs, Directors, or Managers.

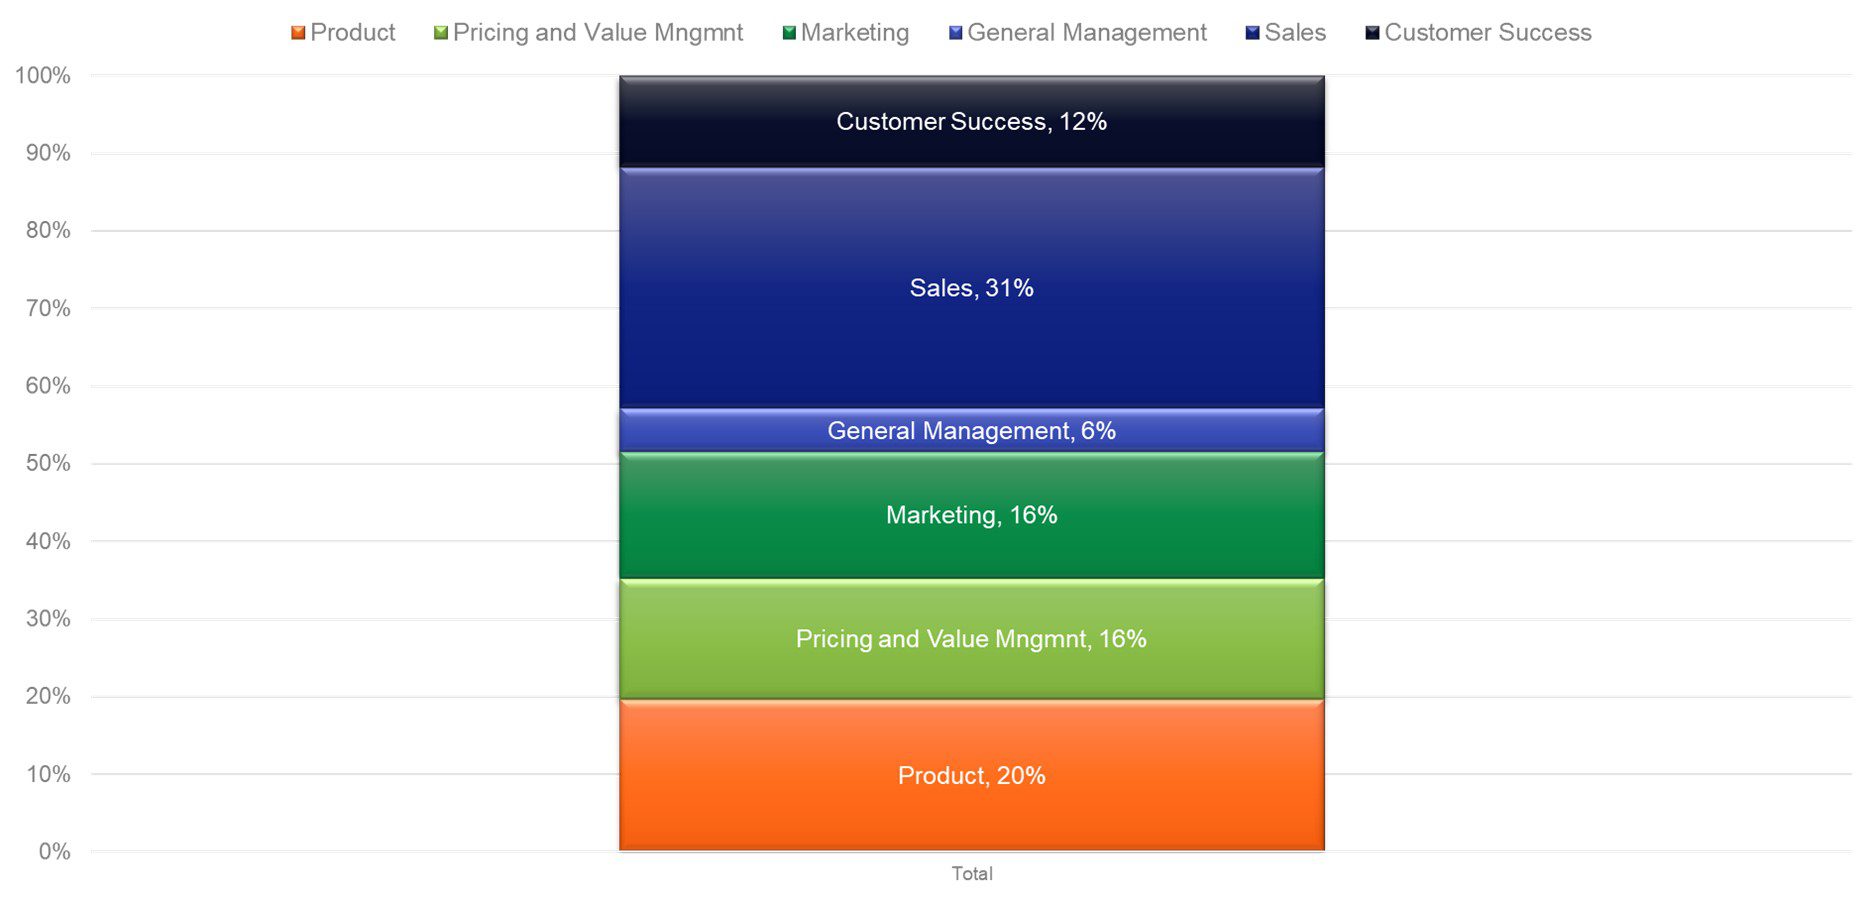
- Job Level: In terms of job function, we also yielded a good mix with 40% of respondents with customer-facing roles, plus good participation from many across marketing, pricing and product, many of whom directly interact with customers. Sales was most represented of the functional areas – 31% of respondents.

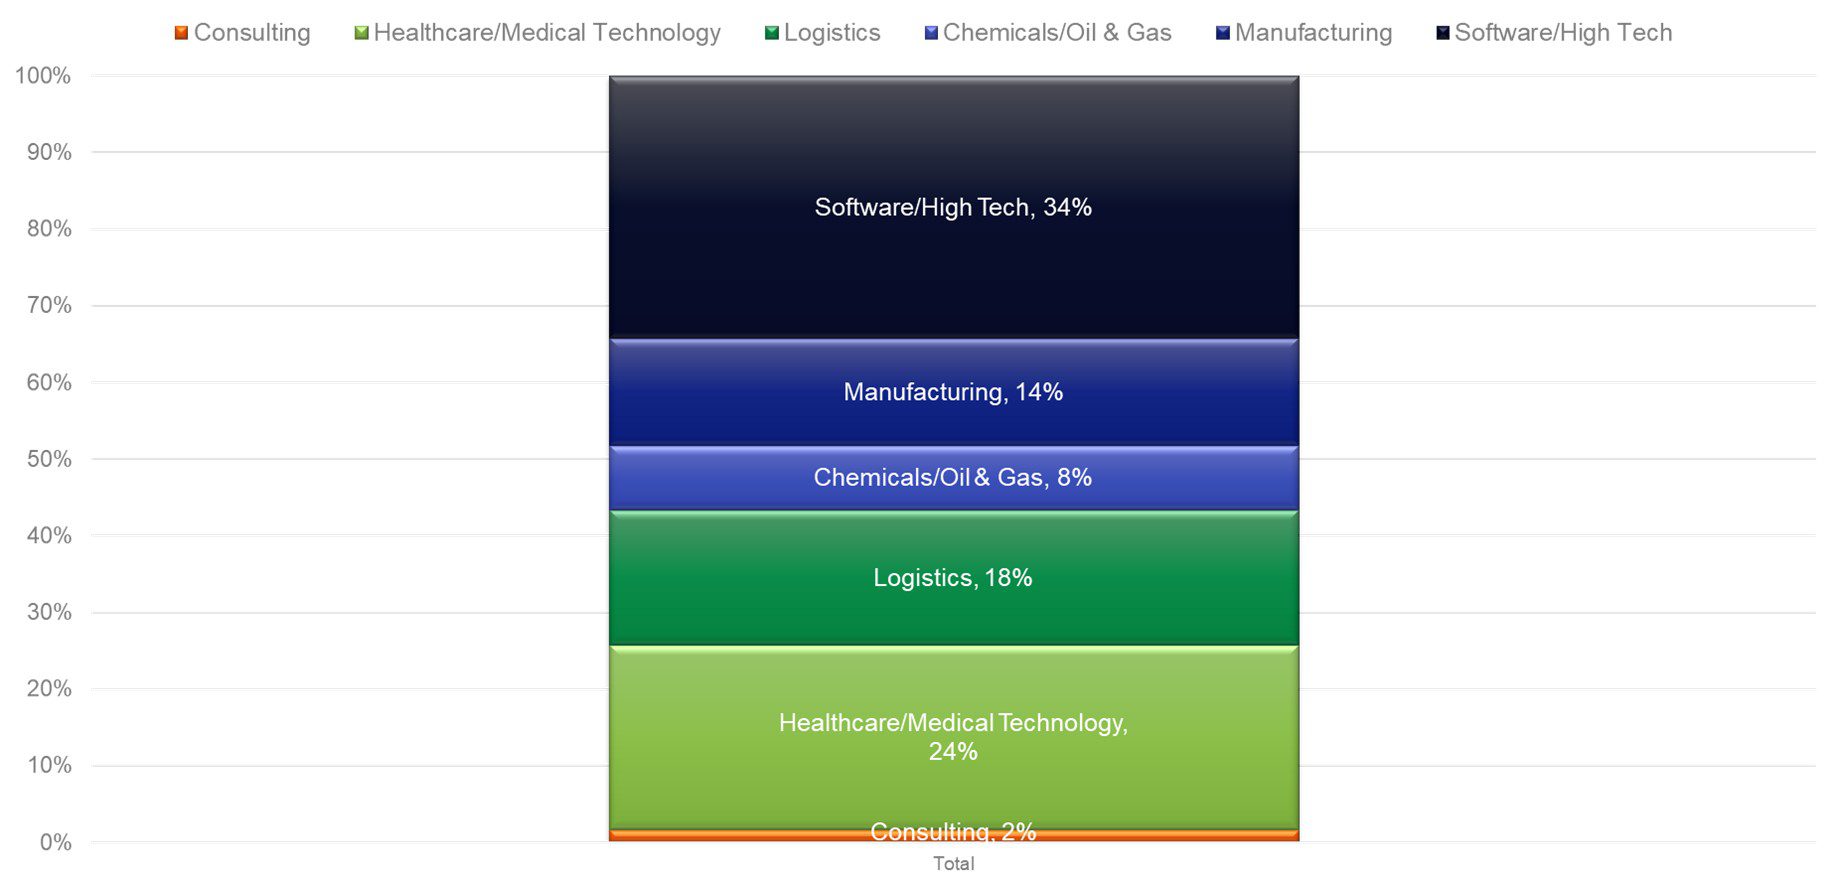
- Industry: In terms of most common industry buckets, Software/High Tech came in first with 34%, manufacturing and specialty chemicals combined to total 20%, 18% were in logistics, and 24% in healthcare/medtech. All of these fields are innovative, differentiated businesses where value plays a natural role.

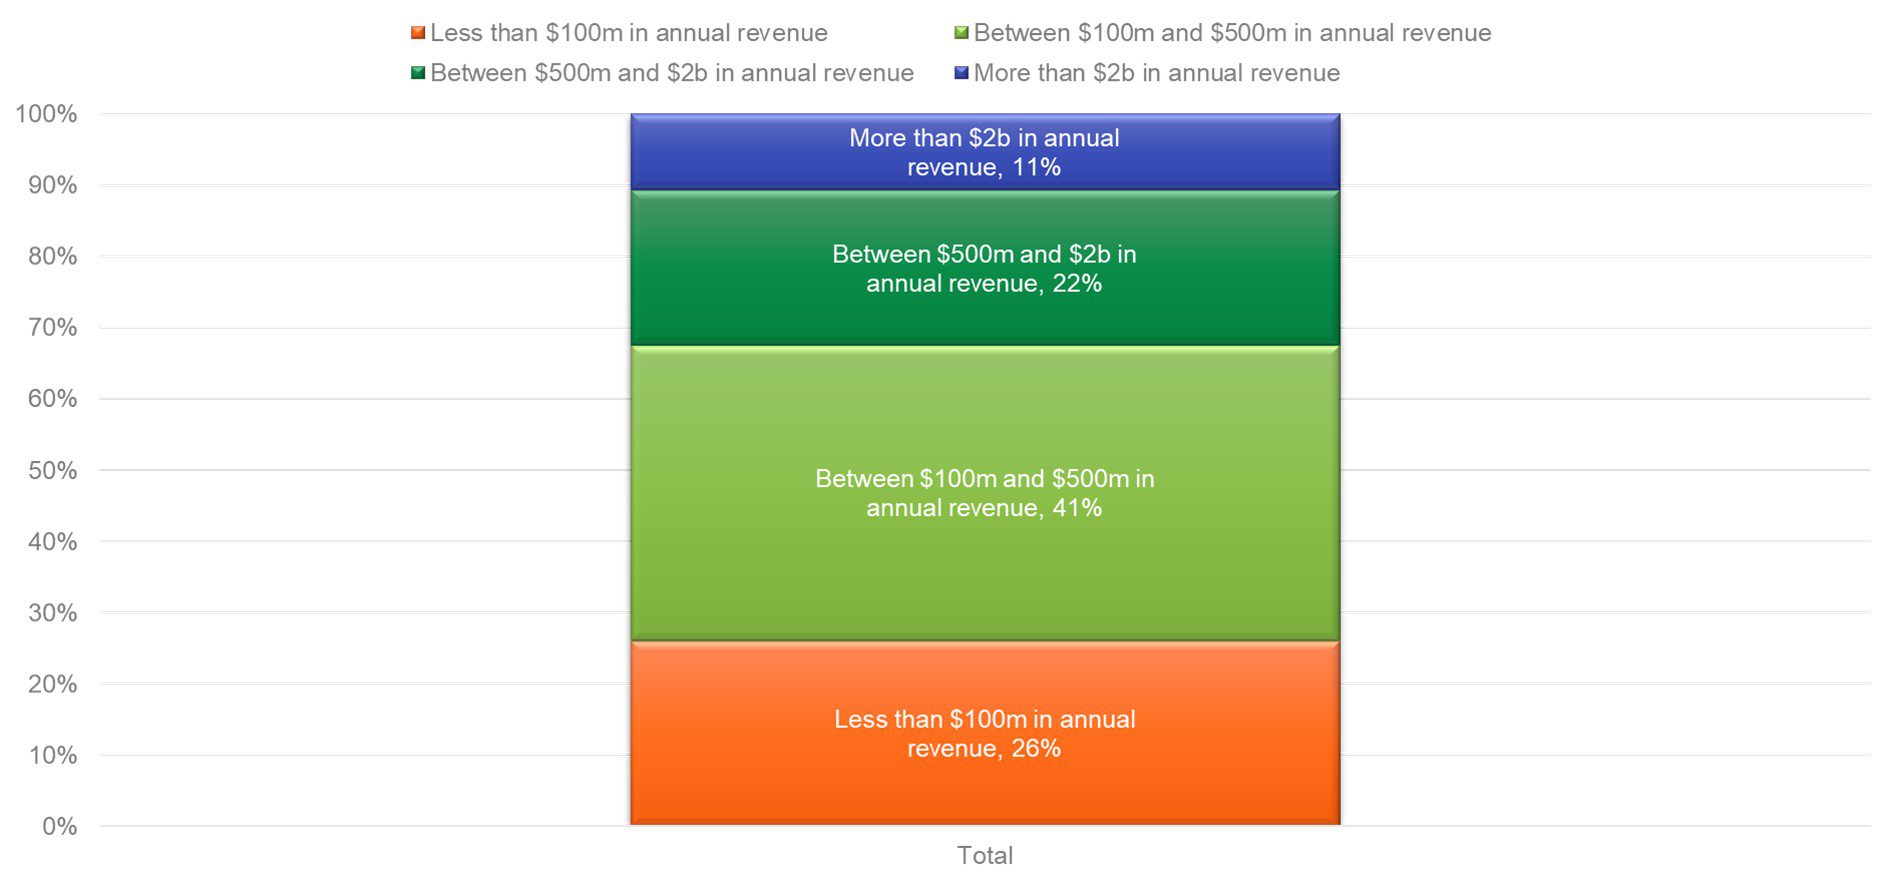
- Organization Size: In terms of organization size, we see a third of respondents were over $500m in annual revenue, and two thirds below. One caveat is that we phrased the question in terms of org size, which may not tell us about whether it’s part of a larger enterprise. In future surveys, we might consider changing the phrasing of this question.

How does your organization perceive your success in value management? Our next updates will explore important questions such as:
- What is a value proposition? How do participants define value management and value selling?
- When is customer value utilized in making decisions for new and existing offerings?
- When in the sales process are value selling tactics deployed?
- How are leading companies embedding customer value in the sales process?
- What are some useful ways for individuals and organizations to improve their value management efforts?
As we look ahead to 2023, we look forward to sharing our findings and recommended best practices in the hope that it helps you improve your B2B commercial performance in the coming year and beyond!

